Hospice Trends 2014-2023
The number of total hospices increased between 2022 and 2023, as did the number of hospice visits. The analysis of hospice utilization trends is outlined below and is based on data reported to the California Department of Health Care Information and Access (HCAI) from the Annual Utilization Report of Home Health Agencies/Hospices for the years 2014 through 2023. CAHSAH’s November Bulletin reported on home health ten-year trends. What follows is an analysis of the 2023 hospice data which is the most recent data that has been reported.
Number of Hospices
In 2023, 2134 hospices filed reports with HCAI. This does not include 631 hospice agencies which failed to file reports. Of the hospices which filed reports, 2098 were “hospice only” programs while 36 were home health agencies with hospice programs. A total of 1840 hospices reported at least one hospice visit. The total number of hospices reporting has grown from 680 agencies in 2014 to 2134 agencies in 2023, representing a growth of 214% between 2014 and 2023. The number of total hospices grew again with a 1.4% increase between 2022 and 2023.
Table 1
|
Type |
2014 |
2015 |
2016 |
2017 |
2018 |
2019 |
2020 |
2021 |
2022 |
2023 |
|
Hospice Only |
630 |
730 |
793 |
923 |
1041 |
1247 |
1354 |
1651 |
2066 |
2098 |
|
Home Health Agency with Hospice |
50 |
45 |
38 |
32 |
40 |
40 |
43 |
39 |
38 |
36 |
|
Total Hospices |
680 |
775 |
831 |
955 |
1081 |
1287 |
1397 |
1690 |
2104 |
2134 |
Length of Stay
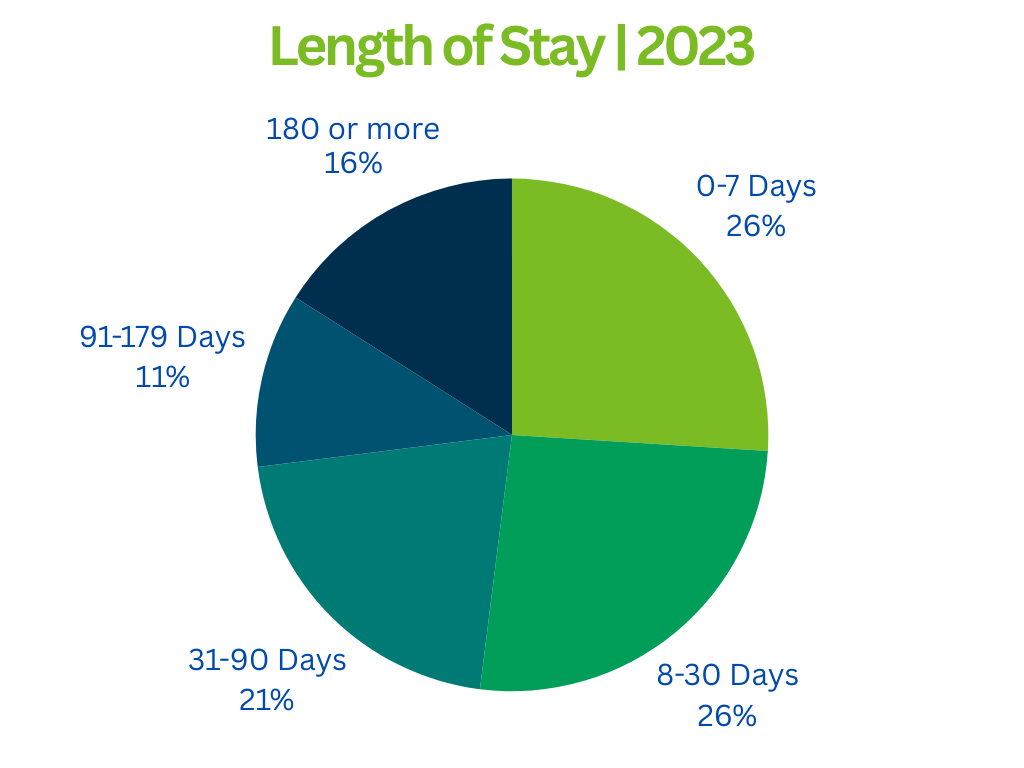
One of the significant issues in hospice is that patients are often admitted to hospice at a very late stage of their disease process. Consequently, their length of stay is less than optimal. This phenomenon is supported by the data. As shown in Chart 2, 26% of patients had a length of stay of 7 days or less, while another 26% had a length of stay of 8 to 30 days. Sixteen percent had a length of stay of 180 or more days and 21% had a length of stay of 31 to 90 days. The average length of stay in 2023 for a hospice patient was 108 days compared with 2022 which was 102 days. The overall distribution of length of stay changed only slightly since 2022 with a one percent change for 0-7 days, 8-30 days, and 31-90 days.
Chart 2

Diagnosis
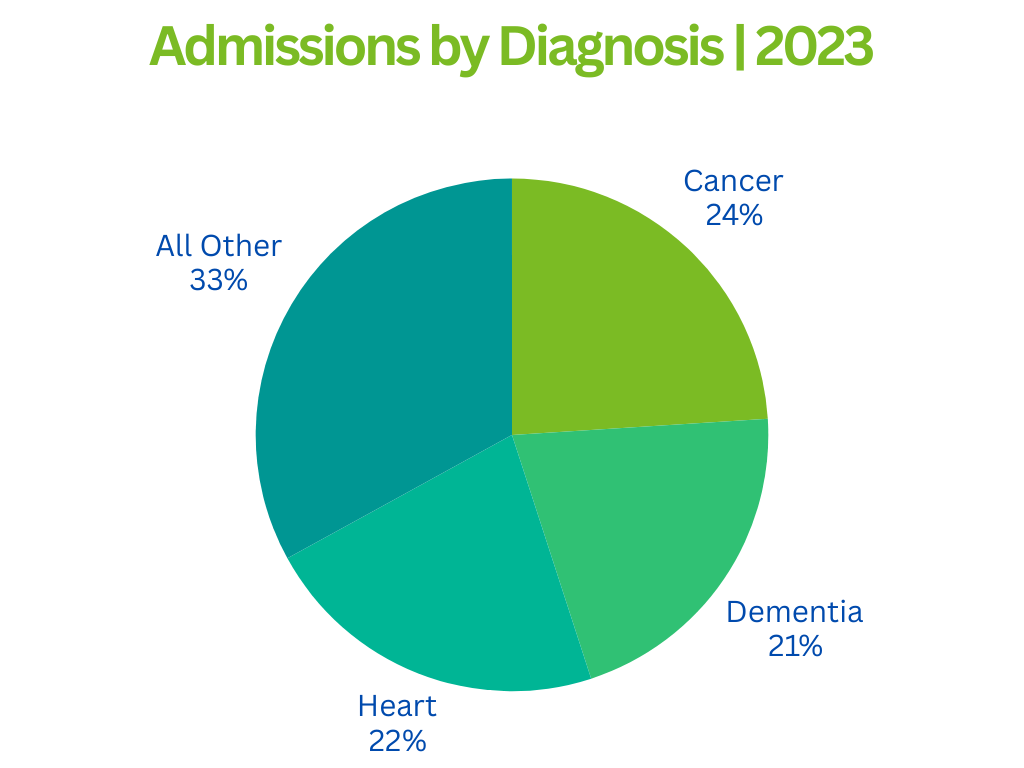
As shown in Chart 3, “All Other Diagnosis” once again took the prevalent position in the overall distribution, accounting for 33% of the diagnoses. Cancer followed, representing 24% of the diagnoses. While “dementia diagnosis” accounted for 21% and “heart diagnosis” represented 22%. The overall distribution of diagnoses did change since 2022 as represented in Chart 3. Cancer decreased its share of the overall distribution by 4% and heart increased its share by one percent.
Chart 3

Visits by Discipline
Hospices reported making more visits in 2023 than in 2022 with total visits at 11,810,744 representing an increase of 19% from 2022, as shown in Table 2. LVN visits grew the most over the ten-year timeframe, increasing 131% since 2014. In 2023, registered nurse (RN) visits were the most common type of visits at 34% of all visits. Home health aide visits were the second most common at 32% followed by licensed vocational nurse (LVN) at 18%. Social worker visits accounted for 6% of visits in 2023 and all other visits represented 10% of visits. The overall distribution of percentage of visits by discipline has changed since 2022. RN visits increased its overall share of the distribution by 3% and LVN visits increased its share by 2%.
Table 2
|
Discipline |
2014 |
2015 |
2016 |
2017 |
2018 |
2019 |
2020 |
2021 |
2022 |
2023 |
|
RN |
2,283,537 |
3,292,516 |
2,756,069 |
2,432,675 |
2,603,822 |
2,777,830 |
2,939,164 |
3,179,023 |
3,040,513 |
4,052,885 |
|
Home Health Aide |
2,643,100 |
3,963,911 |
3,319,410 |
3,135,008 |
3,408,152 |
3,620,994 |
3,250,192 |
3,529,185 |
3,659,666 |
3,800,382 |
|
Social Services |
570,000 |
770,341 |
696,161 |
615,939 |
646,181 |
674,303 |
663,860 |
761,411 |
693,139 |
721,041 |
|
LVN |
893,957 |
1,320,229 |
1,371,357 |
1,382,274 |
1,595,648 |
1,568,484 |
1,579,347 |
1,612,641 |
1,620,057 |
2,069,150 |
|
Chaplain |
367,118 |
524,584 |
491,948 |
447,602 |
471,484 |
495,996 |
463,784 |
571,905 |
570,354 |
783,068 |
|
Physician |
128,391 |
181,141 |
140,500 |
144,783 |
161,249 |
177,293 |
214,713 |
199,798 |
149,560 |
152,482 |
|
Other |
152,805 |
226,767 |
188,903 |
186,286 |
165,282 |
184,192 |
165,982 |
285,021 |
186,196 |
231,736 |
|
Total visits |
7,038,908 |
10,279,489 |
8,964,348 |
8,344,567 |
9,051,818 |
9,499,092 |
9,277,042 |
10,138,984 |
9,919,485 |
11,810,744 |
Days by Location
During 2023, more than 19 million total days of hospice care were provided. This is an 8% increase over the days provided in 2022. Sixty-seven percent of the days were provided at home. Residential Care Facilities for the Elderly (RCFEs) were the location of 20% of the days while Skilled Nursing Facilities (SNFS) were the location for 7%. All other locations accounted for the remaining 6% of days. The overall distribution of days by location has changed since 2022. RCFEs increased its share of the overall distribution by 2% and care in the home also increased its share by 2%.
Level of Care
In 2023, the predominant level of care was routine home care accounting for 93% of total patient care days. Continuous care followed with 6% of the care and inpatient care accounted for .7% of care. Respite care accounted for the remainder at .06%. The distributed levels of care did change since 2022. Continuous care increased its share of the overall distribution of levels of care by nearly 5%.
Gross Revenue by Payor
During 2023, California hospices had total gross revenue of $5,004,752,924. Between 2022 and 2023 gross revenues increased by 5% compared with the time period between 2021 and 2022 which had a 20% increase.
In 2023, Medicare was the source of payment for 84% of all days and continues to take the highest percentage of the payor distribution. Medi-Cal fee-for-service paid for 6% of the days and Medi-Cal managed care paid for 5% of hospice care. All other payors accounted for the remaining 5%. The overall distribution of payor sources did change in 2023. Medicare increased its share of the overall distribution by 2% compared with 2022.
Profitability
In 2023, California hospices had total operating revenue of $4,862,779,366 and total operating expenses of $4,101,675,916. Consequently, net income from operations was $761,103,450. California hospices paid income taxes of $19,172,564 leaving them with net income of $741,930,886. This resulted in a profit margin of 15% for 2023 (net income divided by total operating revenue) which is the same profit margin as 2022.
